An enriched presentation of the Transatlantic Slave Trade
Over a number of decades, David Eltis et al. have made efforts to build a database of the voyages in the Transatlantic slave trade. About the database, David has stated that it "and its successors never will record every voyage that set out to obtain slaves." 1 The database remains an invaluable resource for conveying the scale of the trade, and I wanted to present it in a way that would convey the timeline of trade to specific regions in the Americas and the volume of trade to those regions from specific parts of Africa.
This idea came about when I looked at this map.
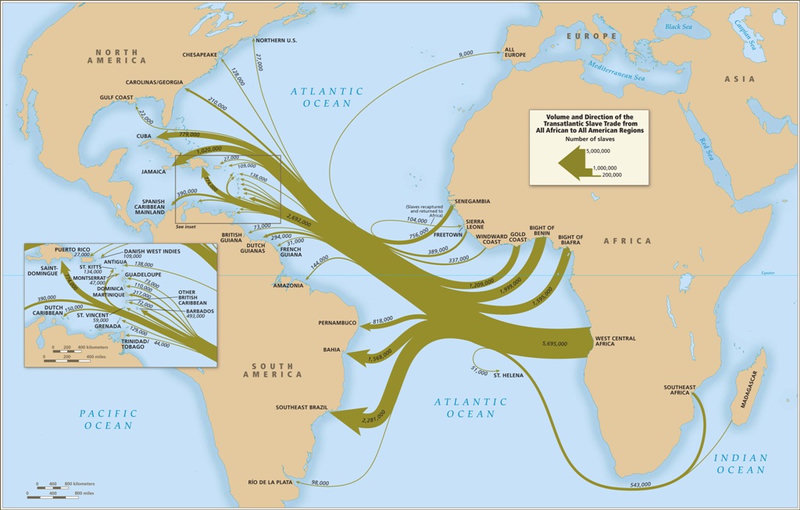
The "Volume and Direction of the Trans-Atlantic Slave Trade" map in Eltis and Richardson's Atlas of the Transatlantic Slave Trade is quite encompassing, conveying the numbers of the enslaved from various origins in Africa to destinations in the Americas. But a fixed map can only show aggregate patterns. It can't answer granular questions like: how many enslaved people from the Senegambia region went to Cuba? What I've created below is a flow visualization—a different way of exploring the same data that lets you trace specific routes and examine regional dynamics over time.
In the bottom table you are able to explore different voyages in the database organized by embarkment region. The lines across the Atlantic do not represent the actual routes taken by ships; they are a flow visualization meant to convey origin, destination, and volume. I have no knowledge of the wind patterns that maritime vessels employed in these oceans.
I explicitly account for the deaths in each voyage—they shouldn't be forgotten.
What you can also learn is the timespan of trade for a specific region or port in the Americas. It's a useful data point for understanding colonization activity in particular regions during the 16th through 19th centuries. The timeline may also reflect the abolition of trade in different regions. Howeve, the database might not include smuggling and doesn't account for overland trade.
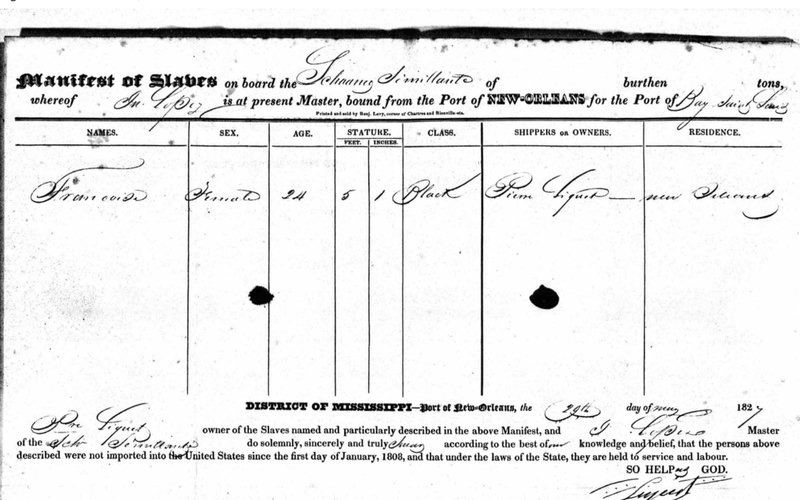
To emphasize David's words: this is not comprehensive. Two such examples are: (1) the Schooner Sémillante manifest and (2) Pierre Lafitte's smuggling of enslaved people.
Eltis, David. "The volume and structure of the transatlantic slave trade: A reassessment." The William and Mary Quarterly 58.1 (2001): 17-46.